Google Analytics provides some great reports to work with out of the box, but the ability to customize and build your own reports from scratch is what allows marketers to gain truly valuable insights from the tool.
Not only is this a huge time saver, it’s also a great way to get ideas for reports you might not otherwise think to create. After all, you’ve got access to the templates and systems that some of the best thinkers in analytics use on a day-to-day basis, and you can customize them even further according to your needs!
Reports for Measuring Site Performance & Acquisition Patterns
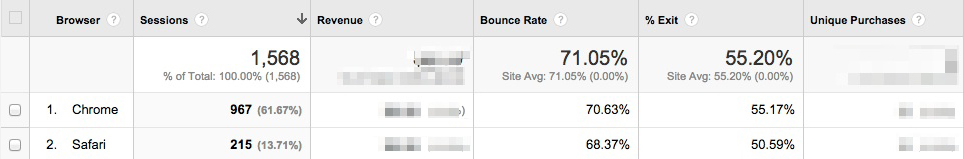
1. Browser Report
One of the most common money leaks on websites is incompatibility with certain browsers. He suggests creating a custom report showing conversions per browser and segmenting the report by device (mobile, desktop, tablet) so as not to skew your numbers.
Search Engine Watch links to a similar pre-made report in their list of time-saving custom reports. If you’re not selling products on your site you can swap out Revenue and Unique Purchases for conversion and goal value-related metrics. And don’t forget to segment by device!
2. Visitor Acquisition Efficiency Analysis Report
This report was to organize key methods that reveal the performance of each stream of traffic to a website. You’ll see total sessions, unique users, new users, goal conversion rate and goal value per session, all organized by source and medium.
3. Customer Behavior Report
The report reveals how behavior varies between new and returning users in terms of overall traffic, conversion patterns and event completion.
4. Mobile Performance Report
This report is ideal for understanding how well your site is optimized for mobile and where you need to make improvements. For example, the site pictured below has a super-high bounce rate for Android; the site’s developers have got some work to do!
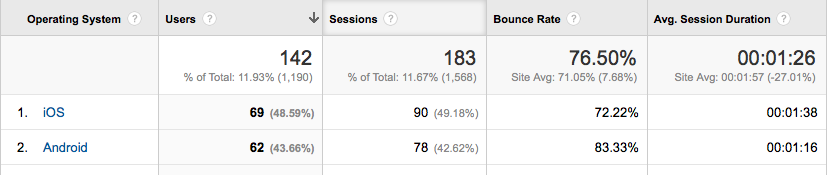
The report is part of a bundle of dashboards and reports created by Avinash Kaushik. >> Get it here.
5. Site Diagnostics: Page Timing Report
It instantly provides details about problematic pages that need your attention. You’ll discover which pages are taking extra long to load as well as which have an uncomfortably-high bounce rate.
Rachelle recommends that you switch from the “data” table view to the “comparison” table view in order to compare load time to bounce rate; this allows you to view the bounce rate for each page against the site average.
Reports That Tell You How Your Content is Doing
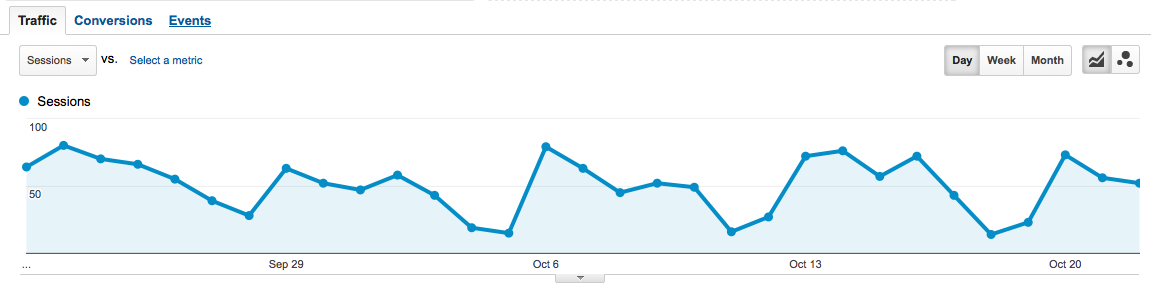
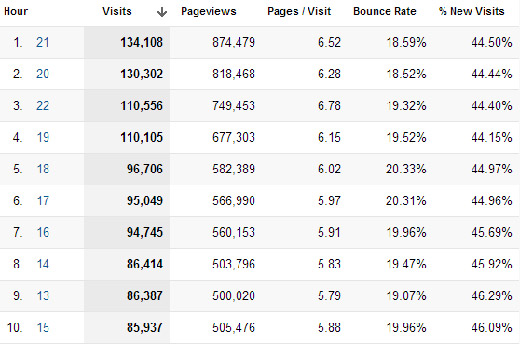
6. Hours & Days Report
The Hours & Days Report shows you which day of the week and at what time of the day your website receives the most traffic. If you set a large time span––say a couple of months––you can use this data to guide experiments with blog post times.
7. Referring Sites Report
Great for identifying the referring sites that provide the most value. It tells you not only which referring sites are generating the most traffic but also how they’re contributing to goal conversions.
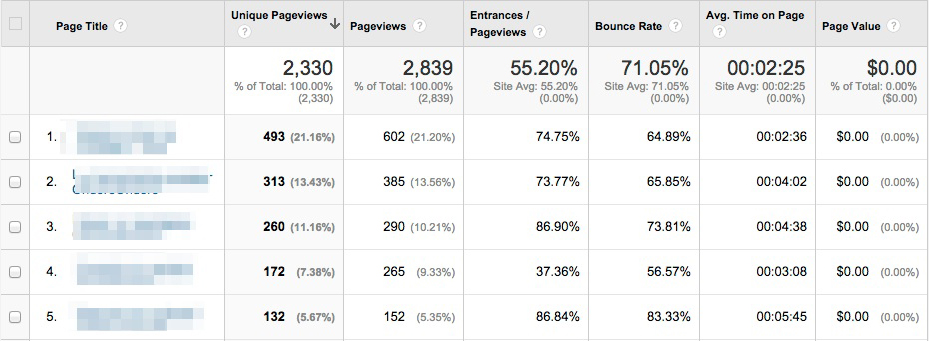
8. Content Efficiency Report
This report to focus on key metrics that will help you identify which pages are performing the best and which need a little optimization. It’s especially useful for sites that produce a lot of content; as, it can help marketers answer important questions like:
- Which content is most engaging?
- Which subject matter experts should we hire more of?
- What type of content (videos, demos, pictures, reviews etc.) do visitors value more?
- Which content delivers business or non-profit value?
9. Traffic Acquisition from Social Media Report
This report shows you not only which social media channels are driving the most traffic to your site but also whether or not that traffic is translating into tangible results for your business. Metrics like Goal Conversion Rate and Goal Value will tell you which social media sites you should pay more attention to.
Reports for SEO
10. SEO: Referring Pages Report
This one comes with the Google Analytics starter bundle, and it’s a great way to gauge the effectiveness of your link building efforts and track the top referring links to your website. The “Referral Path” column will tell you exactly which page your links are coming from (not just which website). Bounce Rate and Avg. Session Duration will indicate which links are high-quality, and Per Session Value will tell you which links are generating real business results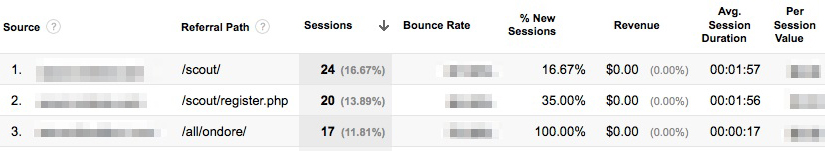
The Google Organic Insights Custom Report provides insights for your “(not provided)” keywords. Showing the landing page URLs along with their page titles gives you a sense of the general keyword themes that people are searching for on Google before arriving at your site.
12. Keyword Analysis Report
This report, which I found via Econsultancy, lists your most popular keywords (excluding the ones encrypted by Google, of course) alongside visitor metrics, conversion rates, goal completions and page load time for each one. There’s also a tab measuring engagement for each keyword, which is interesting for content marketers, and a tab showing revenue metrics.
Wrapping it Up
Installing these Custom Reports templates and then personalizing them even further according to your needs will save you time and most likely reveal insights about your data that you hadn’t expected. Now I’d like to hear from you: Did I miss any of your favorite Custom Reports? Let me know in the comments below.